THE RELATIONSHIP BETWEEN RADIATION ABSORPTION, PHOTOSYNTHESIS, AND PLANT GROWTH
Importance of Radiation Absorption
Increases in plant dry mass are not always associated with increases in photosynthetic rate, particularly when increased internode elongation increases plant height or diameter. Photosynthetic efficiency is rigorously defined as the amount of CO2 fixed per absorbed photon, a ratio known as quantum yield. Longer internodes typically increase the interception and absorption of photons, causing increased plant growth (CO2 fixed or dry mass gain) without an increase in quantum yield (photosynthesis). An increase in the physical process of radiation interception is often incorrectly interpreted as an increase in the biochemical process of photosynthesis.
Plant scientists continue to grossly underestimate the magnitude and importance of side lighting in single-plant studies. The reflective walls of growth chambers mean that side light intensity is only slightly less than that from the top. If a single, spaced plant is considered to be spherical rather than circular, the surface area for radiation interception changes from πr2 to 4πr2, a 400% increase. Even if only the top half of the sphere is exposed to light, the surface area and thus light absorption are still twice that of a circle. In many studies, plant surface area and radiation absorption should be analyzed as a cylinder determined by plant height and width, rather than as a circle determined by width only.
Side lighting means that tall plants intercept more photons and will have a higher growth rate than short plants, even when the irradiance level is identical at the top of the plants. It is important to distinguish between radiation absorption and photosynthesis because the increases in growth or width caused by increased side lighting do not occur in plant communities where plants form a closed canopy and mutual shading eliminates side lighting.
In our studies with wheat canopies, elevated CO2 increased photosynthesis, which increased tillering (branching) and lateral spread at the edges of the plant canopy. Precise measurements of the canopy-absorbing area showed that half of the CO2 effect was caused by increased radiation absorption. The direct CO2 effect on photosynthesis was only about 50% of what we originally measured.
Small increases in lateral spread cause surprisingly large increases in radiation absorption. Figure 1 shows how a 10% increase in lateral spread of a wheat canopy resulted in a 24% increase in plant surface area causing a similar increase in growth rate and a corresponding overestimation of the effect of CO2 on plant growth per unit surface area.
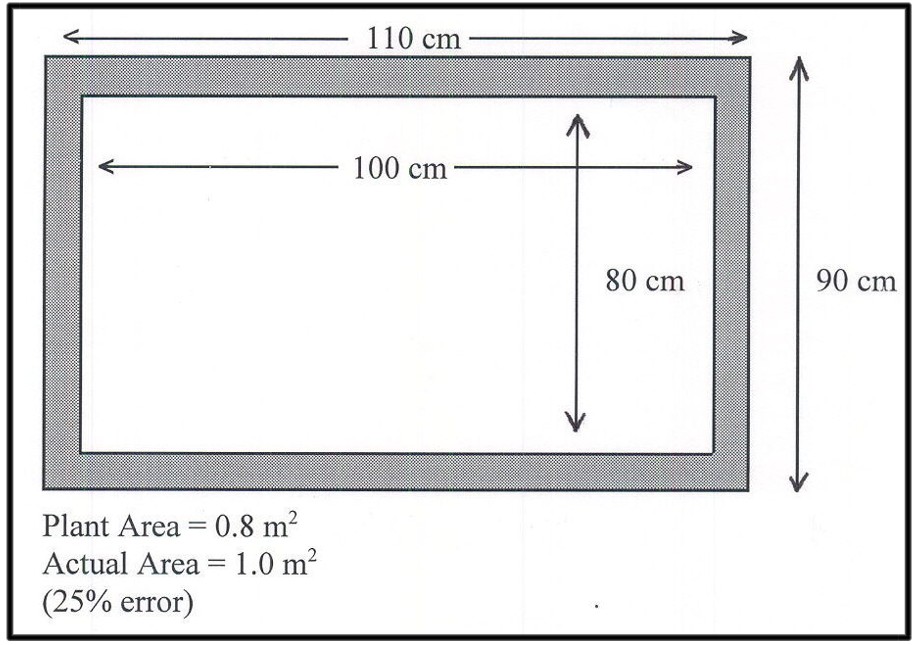
Fig. 1. The effect of a 10% increase in lateral spread (5 cm on all sides) on surface area of a plant canopy. The planted surface area was 0.8 m2. The actual plant growth area was 0.99 m2, resulting in a 24% increase in final/initial surface area. Small increases at the perimeter cause large increases in surface area.
Single-Leaf Maximum Quantum Yield and Whole-Canopy Actual Quantum Yield
Photosynthetic efficiency is routinely measured by determining the maximum quantum yield of single leaves, which occurs only at low PPF (less than 200 μmol m-2 s-1) and is measured at the initial slope of the PPF response curve. It is often useful to determine the average daily quantum yield of whole plants at much higher PPF levels, which requires determining the number of photons absorbed by a whole plant. This is difficult because it requires measuring and integrating the incident, transmitted, and reflected photons on all sides of the plant. However, these measurements are often made in plant canopies where the edge effects are small or can be eliminated by artificial shading (Gallo and Daughtry, 1986).
We have used fiberglass window screen for artificial shading to simulate the effect of additional plants and to minimize edge effects. The screen is hung over a wire that is stretched around the perimeter of the canopy at the top edge. The wire and screen are raised daily as the canopy grows. The window screen extends from the top to the bottom of the canopy. The goal is to create the same vertical radiation attenuation at the edge of the canopy as the center. The data in Table 1 indicate that 3 layers of window screen may be necessary to create a similar radiation attenuation at the edges.
TABLE 1 A comparison of the radiation attenuation from two or three layers of window screen for artificial shading at the edge of a dense wheat canopy.
| Cm from top of canopy | Center of tub | (edge) 3 layers of windowscreen | (edge) layers of windowscreen |
| 0
6 10 17 36 |
1100
750 265 50 0 |
1100
750 225 35 0 |
1100
750 225 100 20 |
Values are for PPF in μmol m-2 s-1
Whole-canopy quantum yield
We calculated average daily canopy quantum yield. This involved integrating net photosynthesis during the light period and was based on the assumption that dark respiration occurs at the same rate in the light and the dark (McCree, 1986). Dark respiration may be slightly lower in the light because ATP can be supplied in leaves by photophosphorylation, or slightly higher because the energy demand for translocation and active uptake are increased. Net photosynthesis plus dark respiration equals gross photosynthesis in μmol m-2 s-1 of CO2. Gross photosynthesis divided by absorbed photons (μmol m-2 s-1) is canopy quantum yield (Bugbee and Monje, 1992; Monje, 1993; Monje and Bugbee, 1994).
DEFINING GROWTH AND DEVELOPMENT
I define plant growth as an increase in dry mass and define plant development as a change in plant shape. These are important distinctions when describing the effect of radiation on internode elongation. An increase in stem elongation is not necessarily an increase in growth. Some radiation environments increase plant height with no change in dry mass, e.g. far-red light can cause rapid stem elongation with no change in photosynthesis or dry mass.
PHOTOSYNTHETIC RATE IS SURPRISINGLY LITTLE AFFECTED BY LIGHT QUALITY FROM STANDARD LAMPS
The effect of radiation quality on photosynthesis has fascinated physiologists for over a hundred years. Early studies were done on photosynthetic bacteria and algae and we have long known that green light is less useful than other colors. McCree (1972a, 1972b) made comprehensive studies of photosynthesis in single leaves and described an average relative quantum efficiency curve (Figure 2), which was replicated by Inada (1976, 1978a, 1978b) and extended by Sager et al. (1982, 1988). However, the most common method of measuring photosynthetically active radiation gives equal value to all photons with wavelengths between 400 and 700 nm and is referred to as Photosynthetic Photon Flux (PPF). Because blue and green photons result in about 25% less photosynthesis than red photons, a PPF sensor overestimates the photosynthetic value of the blue photons from a source, for example, metal halide lamps. However, a PPF sensor does not respond to ultraviolet or far-red radiation and these wavelengths drive some photosynthesis. A lamp with significant amounts of UV and far-red radiation could thus have a higher photosyn-thetic rate than predicted by a PPF sensor.
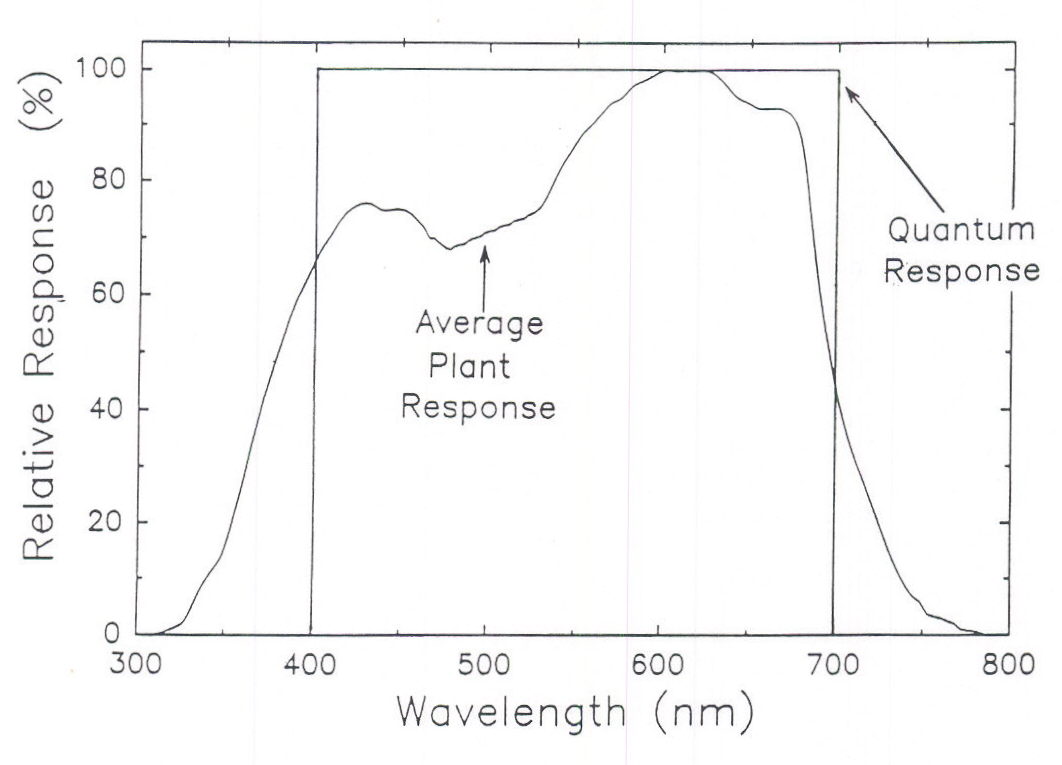
Fig. 2. The quantum (PPF) response when all photons are weighted equally between 400 and 700 nm; and the relative quantum efficiency curve as determined by the average plant response for photosynthesis (from McCree, 1972a). The quantum response overestimates the photosynthetic value of photons between 400 and about 550 nm, but underestimates the photosynthetic value of photons below 400 and above 700 nm.
Differences between the Quantum and the Actual Plant Response for Common Radiation sources
Because the spectral output for electric lamps is reasonably constant, the ratio of the constant photon response (quantum or PPF response) to actual plant response can be calculated from the average quantum efficiency curve (from McCree, 1972a). This ratio is shown in Table 2. The differences among lamp types are surprisingly small. Similar calculations have been described previously (McCree, 1981).
An additional source of error is that all sensors that integrate photosynthetic radiation are imperfect. Barnes et al. (1993) analyzed the errors associated with commercial sensors designed to integrate photosynthetic radiation over a range of wavelengths.
The ratio in Table 2 some lamp types is not intuitively obvious so it is useful to plot the spectral output from the lamps (Figure 3) and plot this output with the average plant response curve (Figure 4).
TABLE 2. The spectral efficiency of six electric lamps and sunlight.
Lamp type Ratio
- Low Pressure Sodium (LPS) .99
- High Pressure Sodium (HPS) .95
- Incandescent (INC) .95
- Metal Halide (MH) .90
- Cool White Fluorescent (CWF) .89
- Red Light-Emitting Diode (LED) .89
- Solar on a clear day .88
Spectral efficiency is defined as the ratio of the lamp spectral output multiplied by McCree’s quantum efficiency weighting factors, divided by the number of photons between 400 and 700 nm. Examples are given in Figure 4. The ratio for solar radiation is not a constant (see Figure 3). The LED had a peak output of 660 nm. LED’s with peak outputs at shorter wavelengths wouldhave greater spectral efficiency, e.g. a peak output at 610 nm would result in an efficiency close to 1.0.
PLANT GROWTH IN SOME SPECIES IS SURPRISINGLY LITTLE AFFECTED BY LIGHT QUALITY
Although photosynthesis may not be affected by light quality in short-term studies, the spectral quality from some lamps decreases chlorophyll concentration and alters phytochrome status, which can be detrimental to plant growth in long-term studies. The monochromatic radiation from low-pressure sodium lamps can significantly reduce chlorophyll and plant growth in several dicotyledonous species, for example.

Fig. 3. The spectral characteristics of the seven radiation sources discussed in Table 2. Data are normalized to a peak value of 100 to facilitate comparisons and plotted on a photon flux basis, which is a better predictor of plant response than is energy flux (adapted from Barnes et al., 1993). The solar curve was measured at noon on a sunny ay in Logan, UT. Increasing diffuse radiation (from clouds or low sun angles) shifts the peak to shorter wave-lengths and would tend to decrease the ratio for solar shown in Table 2.
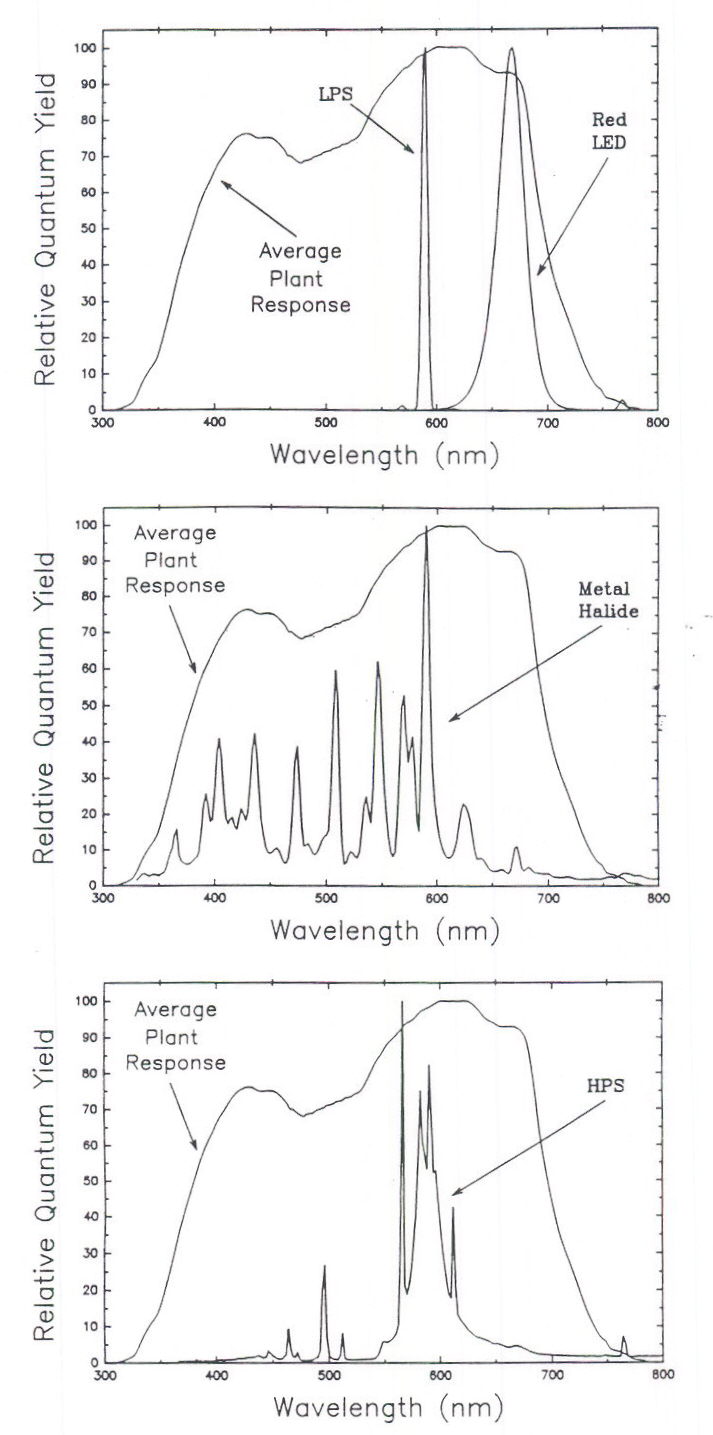
Fig. 4. A comparison of the spectral output from low pressure sodium (LPS), red LED’s, metal halide (MH), and high pressure sodium (HPS) lamps to the average quantum efficiency curve. Monochromatic, LPS lamps are near the peak quantum yield (a ratio of 0.99). Some output of red LED’s exceeds 680 nm where the plant response drops sharply. The ratio for MH lamps (0.90) is reduced because they emit blue photons but this reduction is offset some because they emit photons in the UV region, which are not measured by PPF sensors. HPS lamps have a relatively high ratio (0.95) because most of their output is near the peak quantum yield.
Effect of spectral quality of wheat growth and yield
Not all species are sensitive to spectral quality, however. Low-pressure sodium lamps did not decrease the growth and yield of wheat compared to HPS and MH lamps (Table 3), a finding we recently confirmed. The plants under the low pressure sodium lamps of course did not look green, but the apparent difference in green color disappeared when the plants were removed and placed together in full spectrum light. Studies with wheat grown under red LED’s also indicate that chlorophyll synthesis, photosynthesis, growth, and yield of wheat (Triticum aestivum) are insensitive to spectral quality.
TABLE 3. The effect of radiation source on growth and yield of wheat grown under three radiation sources. (adapted from Guerra et al., 1985).
|
Lamp Type |
Total Biomass
(g m-2) |
Grain Yield
(g m-2) |
| Low Pressure Sodium
High Pressure Sodium Metal Halide |
171
159 162 |
61.7
58.8 62.4 |
| α = 0.05 | n.s. | n.s. |
Effect of HPS and MH lamps on soybean growth and yield
Soybean leaves grown under HPS lamps are visually chlorotic and have reduced chlorophyll concentrations compared with plants grown under MH lamps. However, most plant leaves have excess chlorophyll, and small reductions do not necessarily decrease photosynthetic rates. Three recent studies in our laboratory confirm the reduction in chlorophyll under HPS lamps, but indicate that this reduction does not reduce growth or yield (Table 4). In fact, growth and yield were slightly better under HPS lamps. There was greater petiole elongation in plants grown under HPS lamps, but we lowered the plants as they grew taller to maintain a constant PPF at the top of the canopy. Lateral spread was prevented by enclosing the plants with a double layer of window screen around the perimeter of the stand. The reduced chlorophyll concentration may have increased PPF transmittance and allowed more PPF to penetrate to lower leaves in the canopy, thereby increasing canopy photosynthesis.
TABLE 4. The effect of lamp type on the seed yield of soybean canopies.
| PPF (μmol m-2s-1) | |||
| Lamp type | 400 | 600 | 800 |
| Metal Halide
High Pressure Sodium |
90
100 |
91
100 |
83
100 |
The data are normalized to 100% in each study. In spite of reduced chlorophyll concentrations, soybean canopies grown under HPS lamps had slightly increased yields.
RADIATION INTENSITY: INSTANTANEOUS VS. INTEGRATED DAILY PHOTOSYNTHETIC PHOTON FLUX
Daily plant growth is closely related to the daily integrated PPF (mol m-2 d-1). Leaf emergence rates are determined by daily integrated PPF (Volk and Bugbee, 1991; Faust and Heins, 1993), and physiological and anatomical characteristics of leaves appear to be determined by the integ-rated rather than the instantaneous PPF. When Chabot, Jurik, and Chabot (1979) examined combinations of photoperiod and instantaneous PPF; maximum photosynthetic rate, specific leaf mass, and leaf anatomy were all determined by the integrated daily PPF; instantaneous PPF had little effect.
One of the objectives of the workshop that resulted in these proceedings was to establish guidelines for radiation intensity in controlled environments. The use of high intensity discharge lamps (HPS and MH lamps) means that full summer sunlight (50 to 60 mol m-2 d-1) can easily be obtained in growth chambers. Although the instantaneous value of summer sunlight is about 2000 μmol m-2 s-1, it is not always necessary to obtain this PPF level in growth chambers because the photoperiod can be extended to achieve integrated PPF levels similar to the field. A PPF of only 800 μmol m-2 s-1 during a 16-h photoperiod results in an integrated PPF of 46.1 mol m-2 d-1, which is close to average field values for June and July in much of the northern hemisphere. Some short-day plants require a 12-h photoperiod, which decreases the integrated daily PPF in both field and controlled environments. Geographic locations and seasons (equinoxes) with 12-h photoperiods have lower daily PPF levels (35 to 40 mol m-2 d-1), so high instantaneous PPF levels may still not be required in growth chambers. A PPF of 800 μmol m-2 s-1 with a 12-h photoperiod results in 34.6 mol m-2 d-1.
THE PPF RESPONSE OF SINGLE LEAVES AND CANOPIES
Light response curves for single leaves are well characterized and some workers have suggested that PPF levels that saturate single-leaf photosynthesis are adequate for controlled environment studies. However, canopy photosynthesis saturates at much higher PPF levels than single leaves and PPF levels higher than 1000 μmol m-2 s-1 would be beneficial in some studies. We have found that the photosynthetic response of wheat canopies is linear up to full sunlight (2000 μmol m-2 s-1; Meek, 1990; Figure 5).
Canopy photosynthetic efficiency at a PPF of 100 mol m-2 d-1
The data in Figure 5 (subsequent page) are based on short-term (about 1-h) measurements at each PPF level, and these high photosynthetic rates may not be sustained over longer time intervals. However, our studies indicate that high photosynthetic rates are sustained in wheat canopies over a 20-h photoperiod at twice the integrated daily PPF of full summer sunlight (Figure 6).
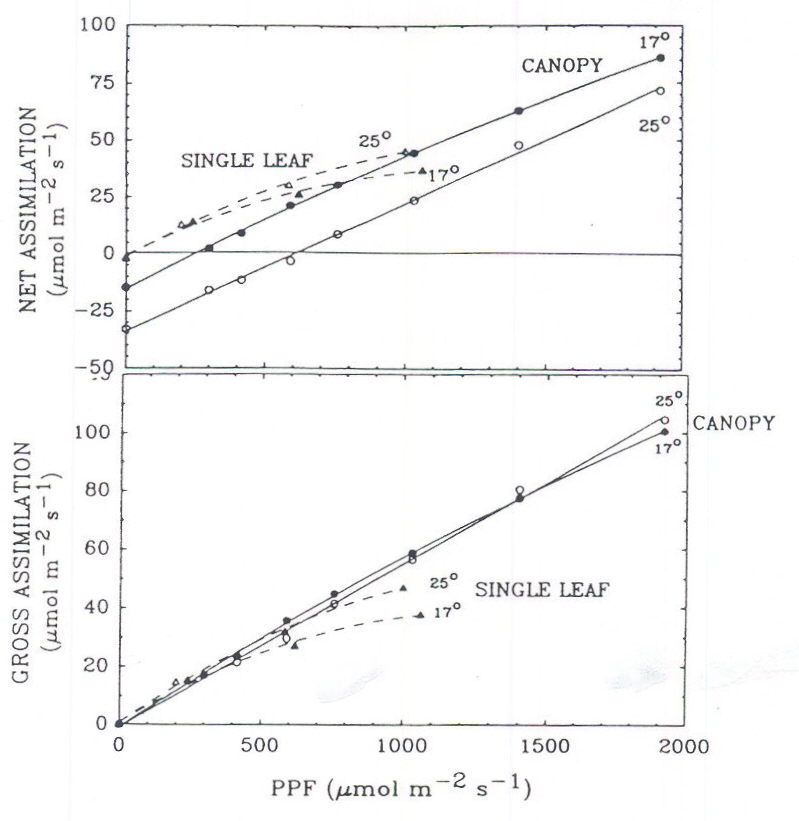
Fig. 5. The photosynthetic response of component wheat leaves and of the intact wheat canopy. The leaves light saturate at a PPF of about 1000 μmol m-2 s-1, but canopy photosyn-thetic rate is linear, even up to the equivalent of full sunlight (2000 μmol m-2 s-1). The canopy was grown at a constant 21° C with elevated CO2 (1200 μmol mol-1). The photosynthetic rate of the single leaves is expressed on a leaf-surface-area basis, and the canopy photosynthetic rate is expressed on a ground or horizontal-surface-area basis. The leaf area index of the canopy exceeded 10, which results in a high dark respiration rate, a high light compensation point, and a linear response to increasing PPF.
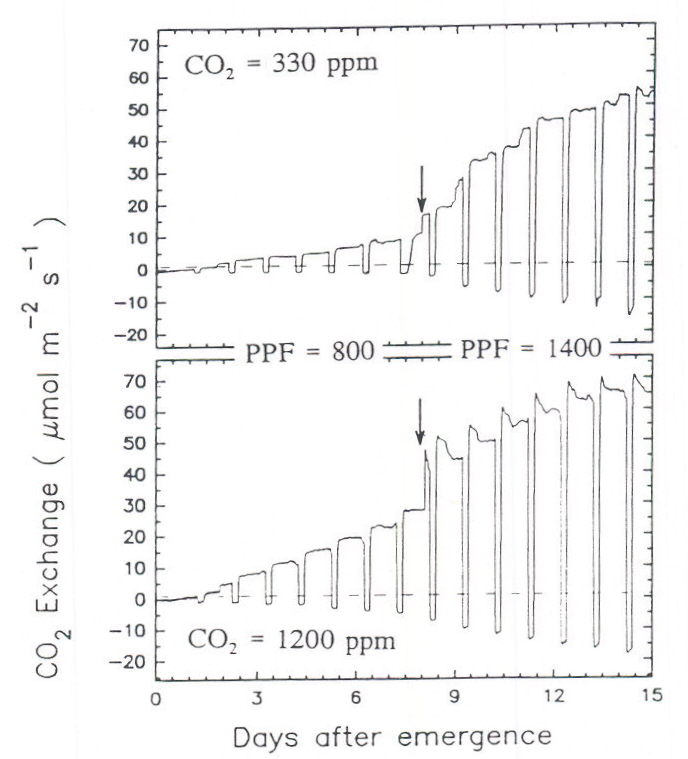
Fig. 6. The photosynthetic rate of wheat canopies grown at two CO2 levels (ambient: 330 and saturating: 1200 μmol mol-1). The arrow indicates a change in the PPF from 800 to 1400 μmol m-2 s-1. The photoperiod was 20-h. There was no evidence for feedback inhibition of photosynthesis, as indicated by a decreasing photosynthetic rate during the photoperiod, in any of the conditions except at the highest PPF level coupled with elevated CO2. The magnitude of feedback inhibition gradually decreased in the days following the increase in PPF. Within about 6 days after the PPF was increased, the decrease in photosynthesis was less than 5% of the rate at the start of the light period. The daily integrated PPF at 1400 μmol m-2 s-1 was 100.8 mol m-2 d-1, or about twice full summer sunlight. Plants were grown at a constant 23° C day/night temperature. Data are from Monje (1993).
CONCLUSIONS
Differences in radiation quality from the six most common electric lamps have little effect on photosynthetic rate. Radiation quality primarily alters growth because of changes in branching or internode elongation, which change radiation absorption. Growth and yield in wheat appear to be insensitive to radiation quality. Growth and yield in soybeans can be slightly increased under high pressure sodium lamps compared to metal halide lamps, in spite of greatly reduced chlorophyll concentrations under HPS lamps. Daily integrated photosynthetic photon flux (mol m-2 d-1) most directly determines leaf anatomy and growth. Photosynthetic photon flux levels of 800 μmol m-2 s-1 are adequate to simulate field daily-integrated PPF levels for both short and long day plants, but plant canopies can benefit from much higher PPF levels.
Acknowledgements
I greatly appreciate the review comments of Frank Salisbury and Tracy Dougher. The insightful editorial assistance of Kurt Gutknecht is also appreciated.
*Research reported in this paper was supported by the National Aeronautics and Space Administration cooperative agreement 2-139, and by the Utah Agricultural Experiment Station. This is Journal paper number 4665.
REFERENCES
Barnes, C., T. Tibbitts, J. Sager, G. Deitzer, D. Bubenheim, G. Koerner, and B. Bugbee. 1993. Accuracy of quantum sensors measuring yield photon flux and photosynthetic photons flux. Hort Science 28:1197-1200.
Bugbee, B. And O. Monje. 1992. The optimization of crop productivity: Theory and validation. Bioscience 42:494-502.
Chabot, B.F., T.W. Jurik, and J.F. Chabot. 1979. Influence of instantaneous and integrated light-flux density on leaf anatomy and photosynthesis. Amer. Jour. Botany 66:940-945.
Faust, J.E. And R.D. Heins. 1993. Modeling leaf development of the African Violet (Saintpaulia ionantha). J. Amer. Soc. Hort. Sci. 118:747-751.
Gallo, K.P. And C.S.T. Daughtry. 1986. Techniques for measuring intercepted and absorbed photosynthetically active radiation in corn canopies. Agron. Jour. 78:752-756.
Guerra, D., A. Anderson, and F.B. Salisbury. 1985. Reduced phenylalanine ammonia-lyase and tyrosine ammonia-lyase activities and lignin synthesis in wheat grown under low pressure sodium lamps. Plant Physiol. 78:126-130.
Inada, K. 1976. Action spectra for photosynthesis in higher plants. Plant Cell Physiol. 17:355-365.
Inada, K. 1978a. Photosynthetic action spectra in higher plants. Plant Cell Physiol. 19:1007-1017.
Inada, K. 1978b. Spectral dependence of photosynthesis in crop plants. Acta Hortic. 87:177-184.
Mccree, K.J. 1972a. The action spectrum, absorbance and quantum yield of photosynthesis in crop plants. Agric. Meteorol. 9:191-216.
Mccree, K.J. 1972b. Test of current definitions of photosynthetically active radiation against leaf photosynthesis data. Agric. Meteorol. 10:443-453.
Mccree, K.J. 1981. Photosynthetically active radiation. Pages 41-55. In: Lange, O.l., P.s. Nobel, C.B. Osmund, and H. Ziegler (eds.), Encyclopedia of Plant Physiology, New Series, Vol. 12a, Physiological Plant Ecology I. Springer Verlag, Berlin.
Mccree, K.J. 1986. Measuring the whole plant daily carbon balance. Photosynthetica 20:82-93.
Meek, D. 1990. The relationship between leaf area index and photosynthetic temperature response in wheat canopies. M.S. Thesis. Utah State University.
Monje, O. 1993. Effects of elevated CO2 on crop growth rates, radiation absorption, canopy quantum yield, canopy carbon use efficiency, and root respiration in wheat. M.S. Thesis. Utah State University.
Sager, J.C., J.L. Edwards, and W.H. Klein. 1982. Light energy utilization efficiency for photosynthesis. Trans. ASAE, 25(6);1737-1746.
Sager, J.C., W.O. Smith, J.L. Edwards and K.L. Cyr. 1988. Photosynthetic efficiency and phytochrome photoequilibria determination using spectral data. Trans. ASAE, 31(6):1882-1889.
Volk, T. And B. Bugbee. 1991. Modeling light and temperature effects on leaf emergence rate in wheat and barley. Crop Science 31:1218-1224.
Bugbee, B. 1994. Effects of radiation quality, intensity, and duration on photosynthesis and growth, p 39-50. In: T.W.Tibbitts (ed.). International Lighting in Controlled Environments Workshop, NASA-CP-95-3309.
Copyright © March 1994 NASA [National Aeronautics and Space Administration].
All rights reserved.